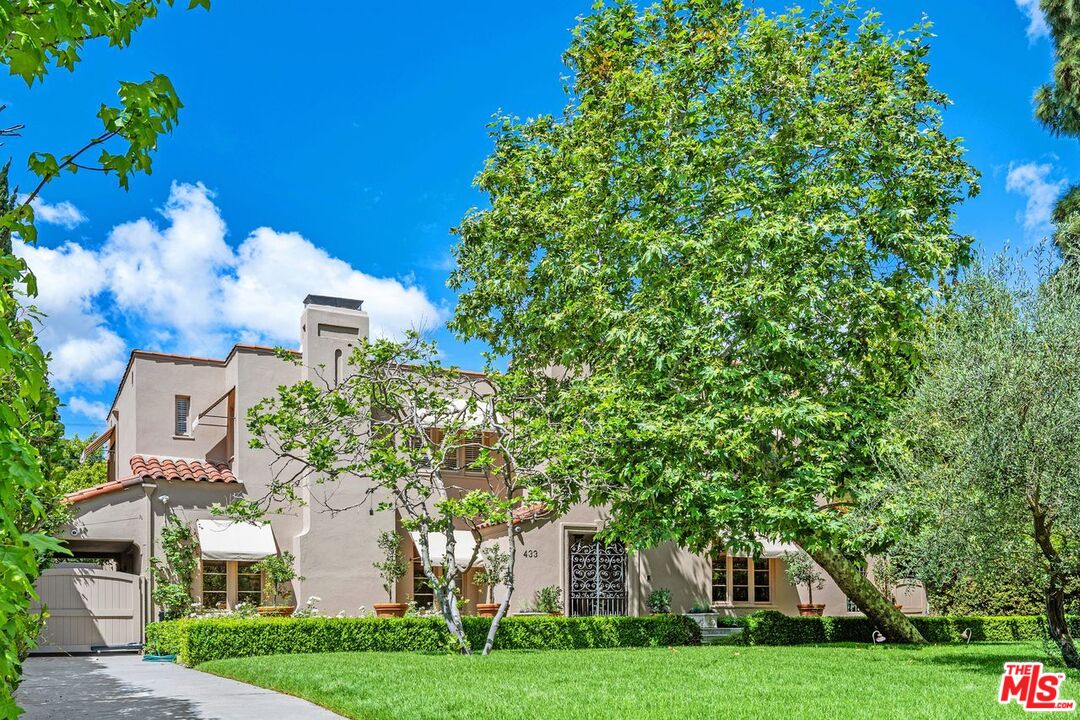
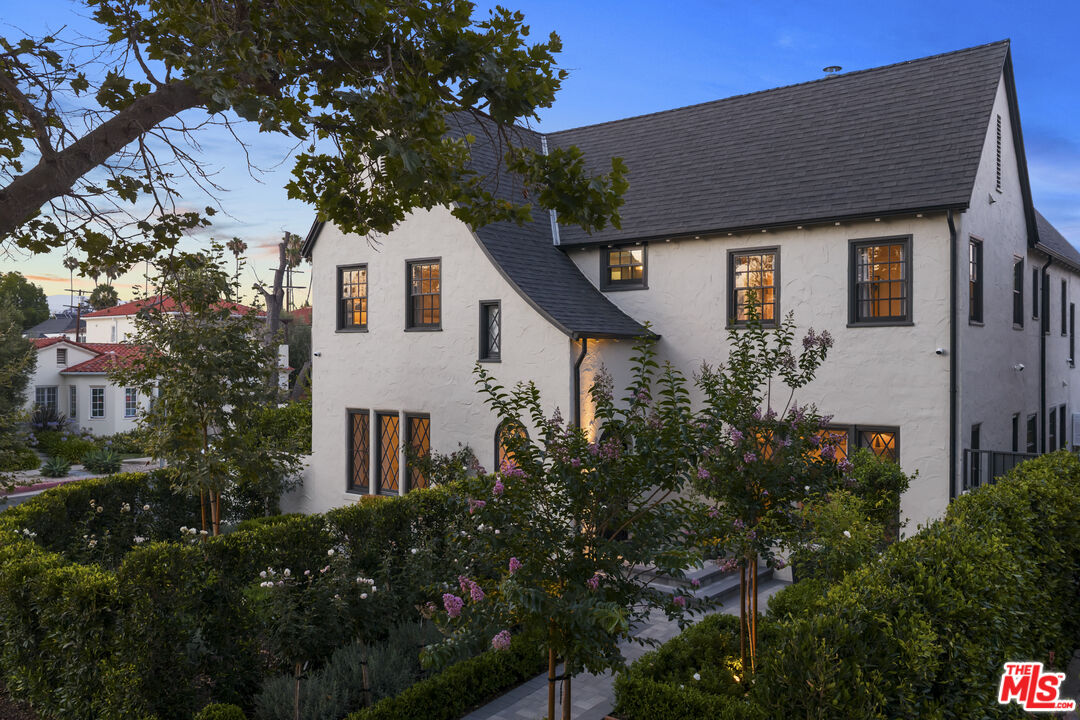
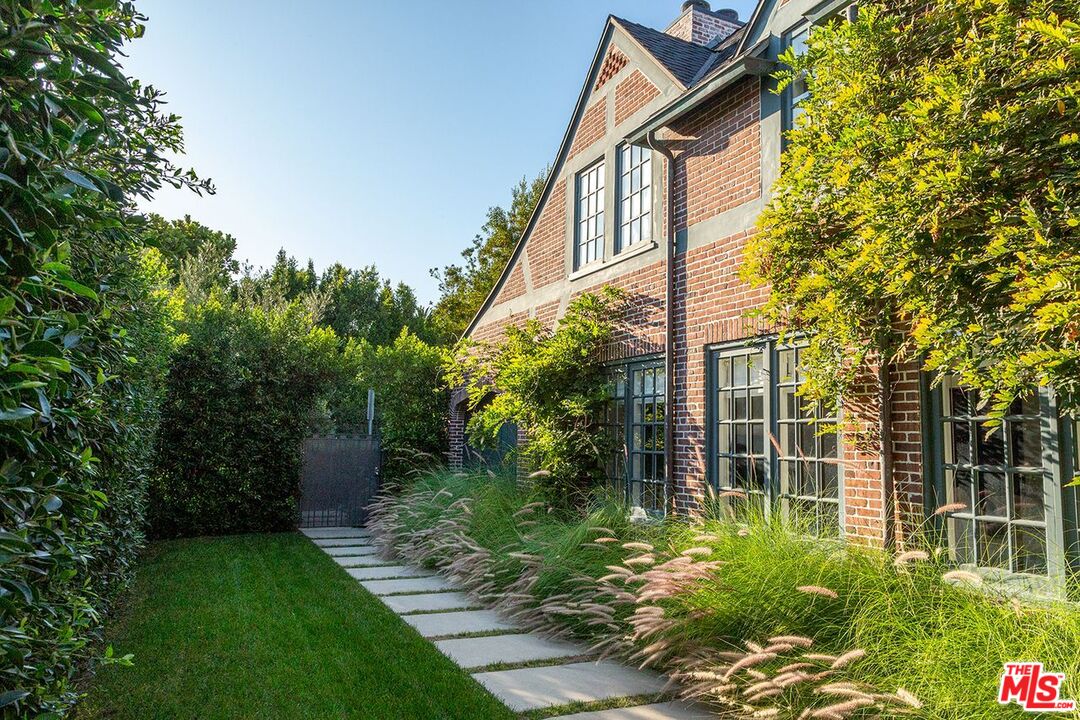
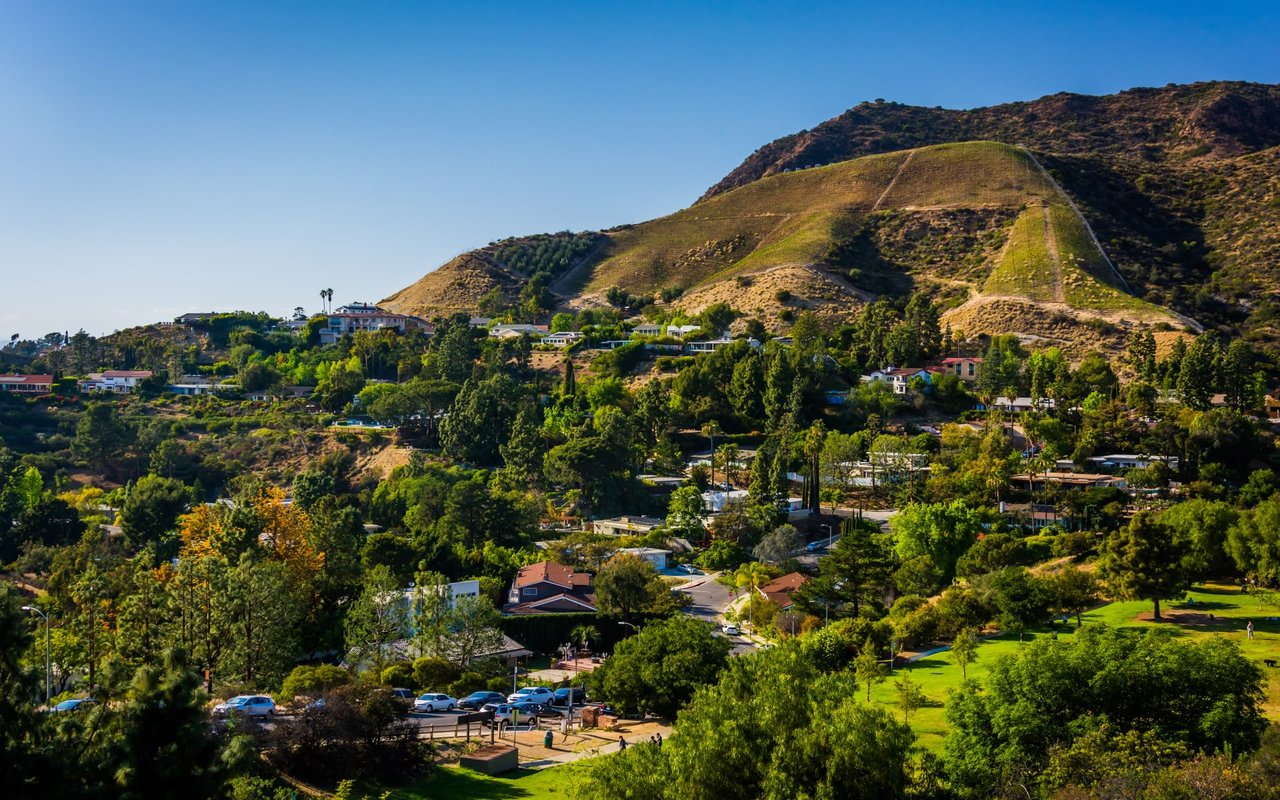
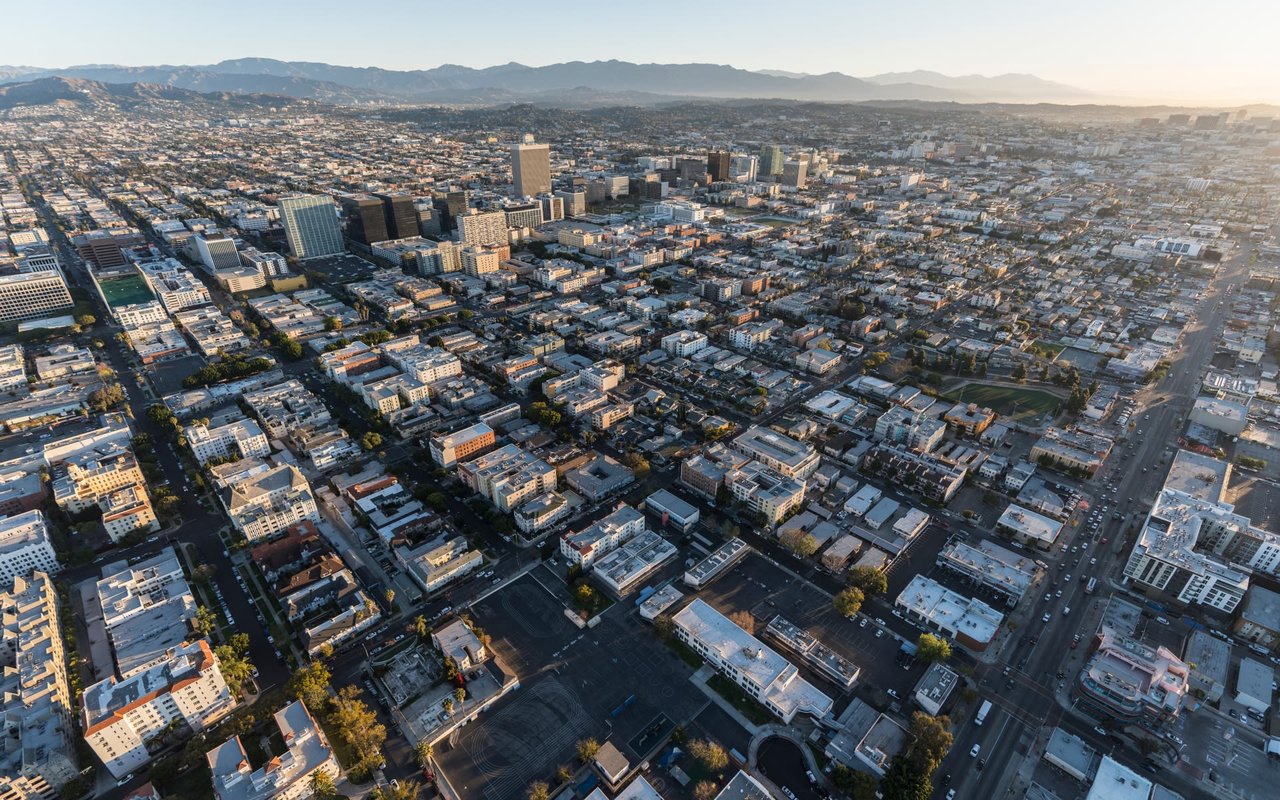
Leave a Message

Thank you for your message. We will be in touch with you shortly.

HANCOCK PARK

Overview for HANCOCK PARK, CA

9,616 people live in HANCOCK PARK, where the median age is 43 and the average individual income is $108,967. Data provided by the U.S. Census Bureau.

9,616

Total Population

43 years

Median Age

High

Population Density Population Density This is the number of people per square mile in a neighborhood.

$108,967

Average individual Income

Around HANCOCK PARK, CA

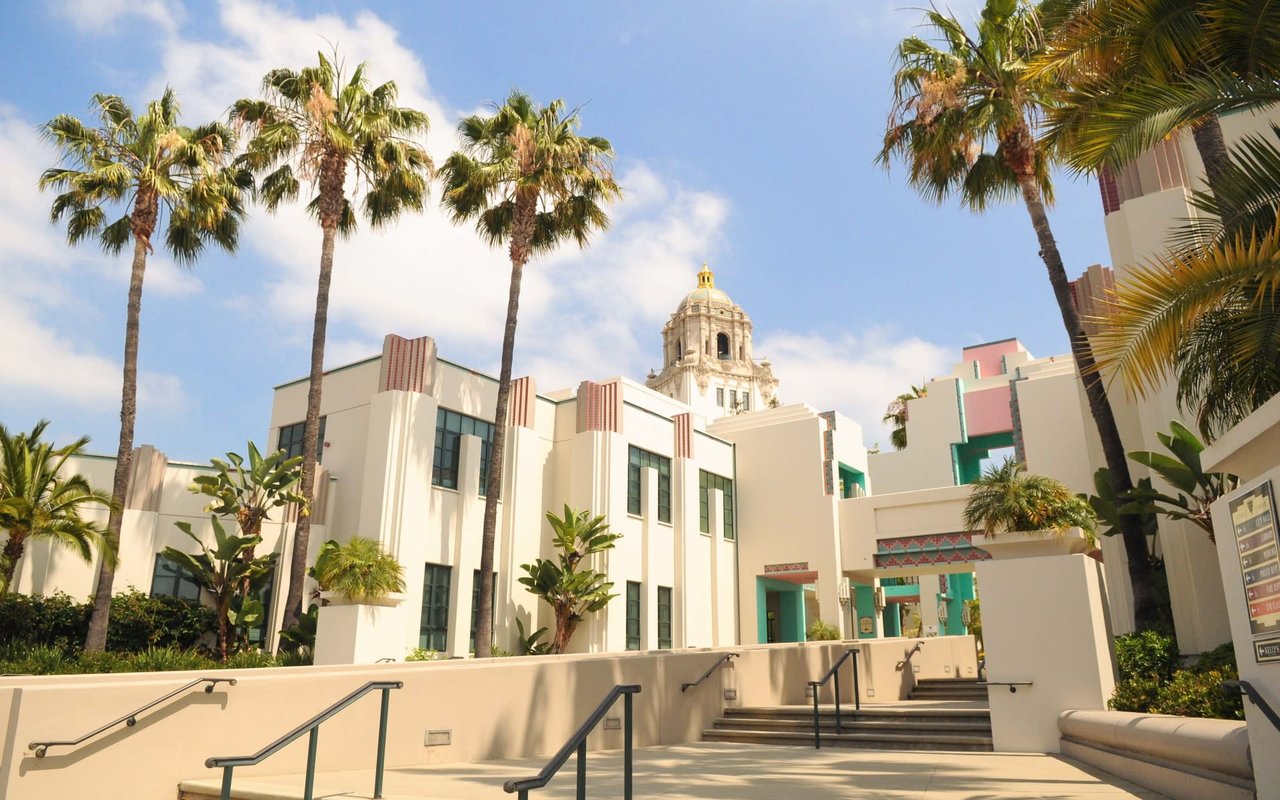
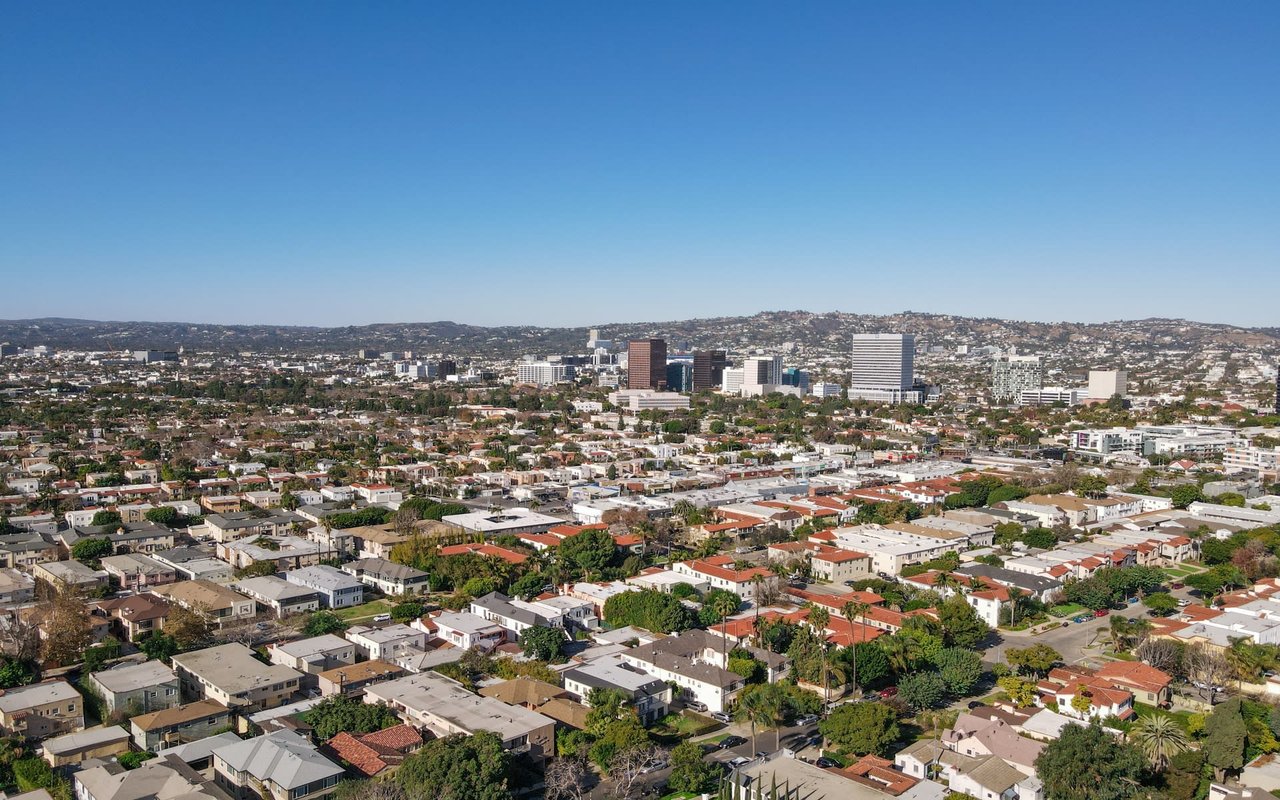
There's plenty to do around HANCOCK PARK, including shopping, dining, nightlife, parks, and more. Data provided by Walk Score and Yelp.
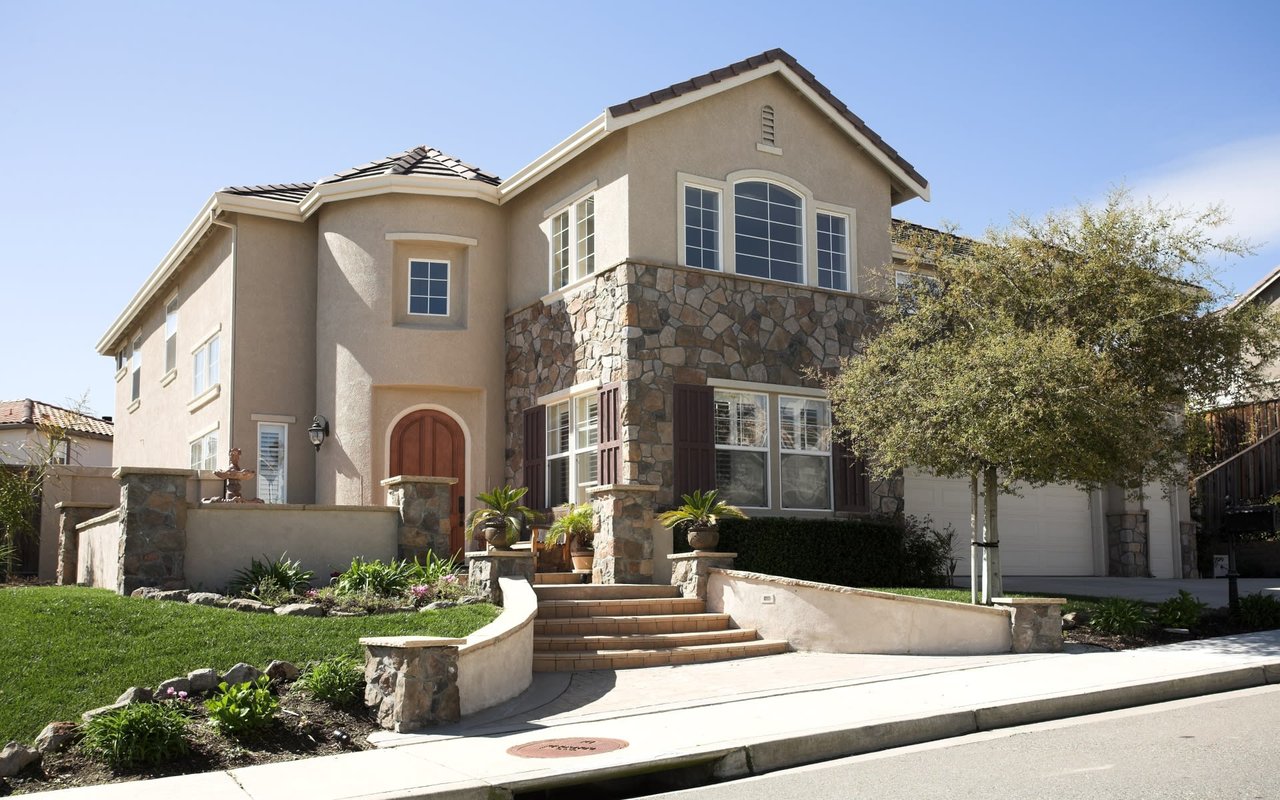
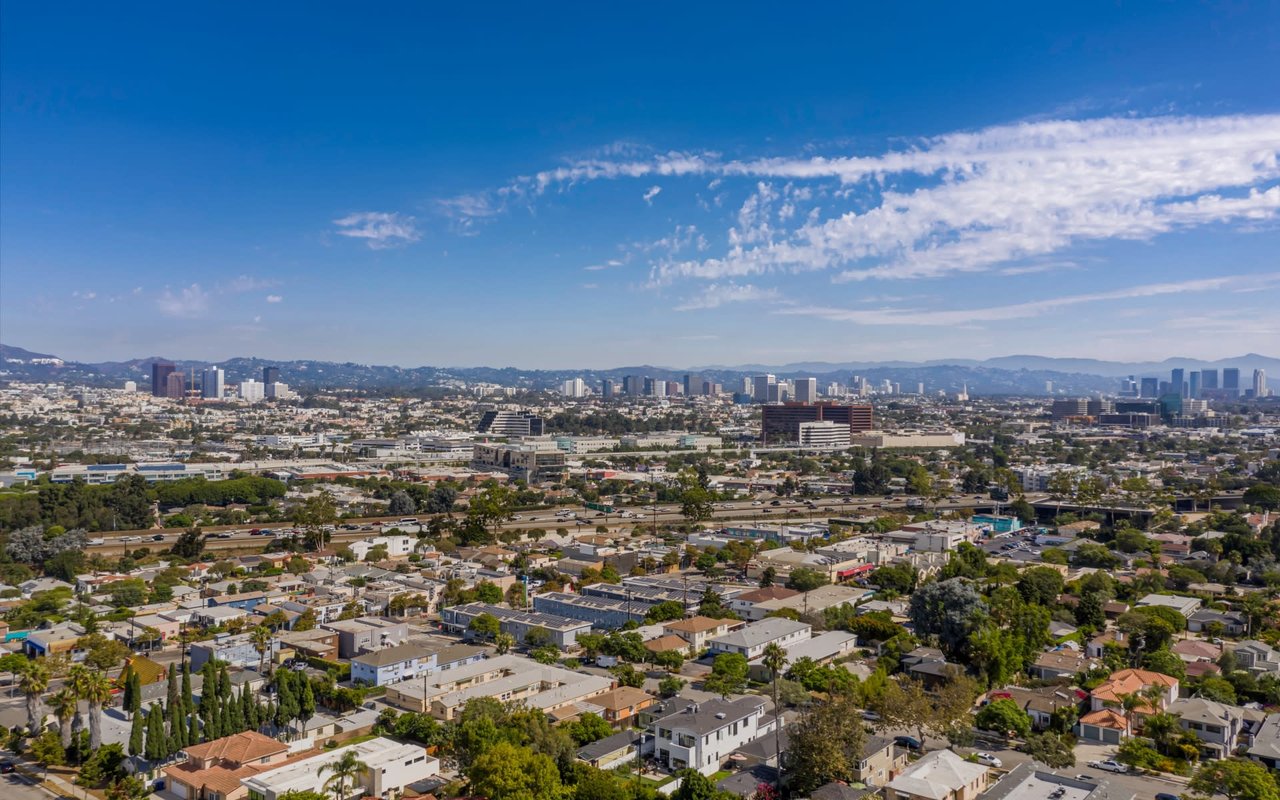
43
Car-Dependent
Walking Score
57
Bikeable
Bike Score
56
Good Transit
Transit Score

Points of Interest

Explore popular things to do in the area, including Quicken Water Mart, Skeela Strong, and New Rich Fitness.

Name Category Distance Reviews
Ratings by Yelp
Dining · $ 4.76 miles 5 reviews 5/5 stars
Active 1.93 miles 5 reviews 5/5 stars
Active 1.21 miles 5 reviews 5/5 stars
Active 2.96 miles 7 reviews 5/5 stars
Active 1.04 miles 5 reviews 5/5 stars
Beauty 2.44 miles 16 reviews 5/5 stars

Demographics and Employment Data for HANCOCK PARK, CA

HANCOCK PARK has 4,406 households, with an average household size of 2. Data provided by the U.S. Census Bureau. Here’s what the people living in HANCOCK PARK do for work — and how long it takes them to get there. Data provided by the U.S. Census Bureau. 9,616 people call HANCOCK PARK home. The population density is 11,452.417 and the largest age group is between 25 and 64 years old. Data provided by the U.S. Census Bureau.

9,616

Total Population

High

Population Density Population Density This is the number of people per square mile in a neighborhood.

43

Median Age

47.19 / 52.81%

Men vs Women

Population by Age Group

0-9: 9.2%

0-9 Years

10-17: 7.65%

10-17 Years

18-24: 5.36%

18-24 Years

25-64: 60.14%

25-64 Years

65-74: 12.01%

65-74 Years

75+: 5.64%

75+ Years

Education Level

  • Less Than 9th Grade 246 (4%)
  • High School Degree 678 (11%)
  • Associate Degree 997 (16%)
  • Bachelor Degree 2954 (47%)
  • Graduate Degree 1369 (22%)
4,406

Total Households

2

Average Household Size

$108,967

Average individual Income

Households with Children

With Children: 837 (19%)

Without Children: 3,569 (81%)

Marital Status

Married 36%
Single 35%
Divorced 10%
Separated 3%

Blue vs White Collar Workers

Blue Collar: 2%

White Collar: 98%

Commute Time

0 to 14 Minutes 10%
15 to 29 Minutes 14%
30 to 59 Minutes 19%
60+ Minutes 2%

Schools in HANCOCK PARK, CA

Primary Schools (1)
Middle Schools (1)
Mixed Schools (4)
The following schools are within or nearby HANCOCK PARK. The rating and statistics can serve as a starting point to make baseline comparisons on the right schools for your family. Data provided by the U.S. Census Bureau.
Type
Name
Category
Grades
School rating
Third Street Elementary
PUBLIC
K - 5th
5/5

Property Listings

This page can't load Google Maps correctly.
Do you own this website?

Work With Nick

Since the beginning of my real estate career 20 years ago, I have held true to one promise above all else: to act as an advocate for my clients. Now a longtime local of LA County, I’m familiar with the impressive luxury market and more determined than ever to buy or list your home or condo with seamless skill.